![]()


- Introduction
- Features
- Installation Guide
- Usage Example
- Notes for Users Migrating from v1
- Local Development
- Contributing
Geolistrik CLI is a command-line utility to generate stacking charts and electrode configuration tables for five common resistivity methods in geophysical survey:
- Wenner-Schlumberger (
ws) - Wenner (
wn) - Pole-Pole (
pp) - Pole-Dipole (
pd) - Dipole-Dipole (
dd)
It saves outputs in .png (chart) and .xlsx (data) formats.
✅ Support 5 geoelectrical array configurations (Wenner, Wenner–Schlumberger, Pole–Pole, Pole–Dipole, Dipole–Dipole)
✅ Explicit and self-documented CLI commands (generate and update)
✅ Flexible input via options (safe and scalable for future versions)
✅ Optional chart generation (--no-plot)
✅ Custom output directory support (--outdir)
✅ Output formats:
.pngstacking chart.xlsxmeasurement table
✅ Automatic update checking after command execution
✅ Designed for students, researchers, surveyors, and geophysics practitioners \
✅ Cross-platform support (Windows & Linux)
Run the installer and follow the instructions.
Restart the CMD, and the Geolistrik CLI is ready to use. But if you accidentally uncheck the Add Geolistrik to PATH environment variable (Recommended) box, then you can add the PATH manually by following the instruction below:
-
After the installation is complete, add the following folder (this where you install the cli):
C:\Program Files (x86)\Geolistrikto your system PATH. This the tutorial:
- Click Start, type "env", and select
Edit the system environment variables
- In the System Properties window, click the
Environment Variables…button
- Under the System Variables section, find
Pathand clickEdit
- In the Edit Environment Variable window, click New to add a new path

- Close all dialogue boxes by clicking
OKto save your changes - Restart terminal to ensure the PATH changes take effect
- Click Start, type "env", and select
-
Open CMD and type:
geolistrik
You'll see the welcome banner:

-
Uninstall:
- Uninstall via Control Panel → Uninstall a Program
- Remove the path entry from the system PATH


-
Make the file executable
For example, if the file is in the~/Downloadsfolder:chmod +x ~/Downloads/geolistrik-linux-1.0.0.bin -
Move the file to a directory in your PATH Typically this would be
~/.local/bin(for local install) or/usr/local/bin(for global install).- Global installation (for all users):
sudo mv ~/Downloads/geolistrik-linux-1.0.0.bin /usr/local/bin/geolistrik - Local installation (for current user only):
First, ensure
~/.local/binis included in your$PATH. Check with:If it’s not included, add it to yourecho $PATH
.bashrcor.zshrc:If it is already included, simply run:echo 'export PATH="$HOME/.local/bin:$PATH"' >> ~/.bashrc source ~/.bashrc
Now you can use the CLI from anywhere:mkdir -p ~/.local/bin mv ~/Downloads/geolistrik-linux-1.0.0.bin ~/.local/bin/geolistrik
Just like on Windows, you should see a welcome banner.geolistrik
- Global installation (for all users):
-
Uninstall
Simply delete the binary from your system:sudo rm /usr/local/bin/geolistrik
Geolistrik CLI uses a command-based structure.
The main command for data generation is generate.
geolistrik generate \
  --configuration <code> \
  --start-position <start> \
  --end-position <end> \
  --spacing <spacing> \
  [--outdir <directory>] \
  [--no-plot] \
  [--verbose]
or for simple command
geolistrik generate \
  -c <code> \
  -s <start> \
  -e <end> \
  -a <spacing> \
  [-o <directory>] \
  [--no-plot] \
  [--verbose]
| Code | Configuration |
|---|---|
| wn | Wenner |
| ws | Wenner–Schlumberger |
| pp | Pole–Pole |
| pd | Pole–Dipole |
| dd | Dipole–Dipole |
By default, this command generates:
- A stacking chart image (.png)
- A measurement table (.xlsx)
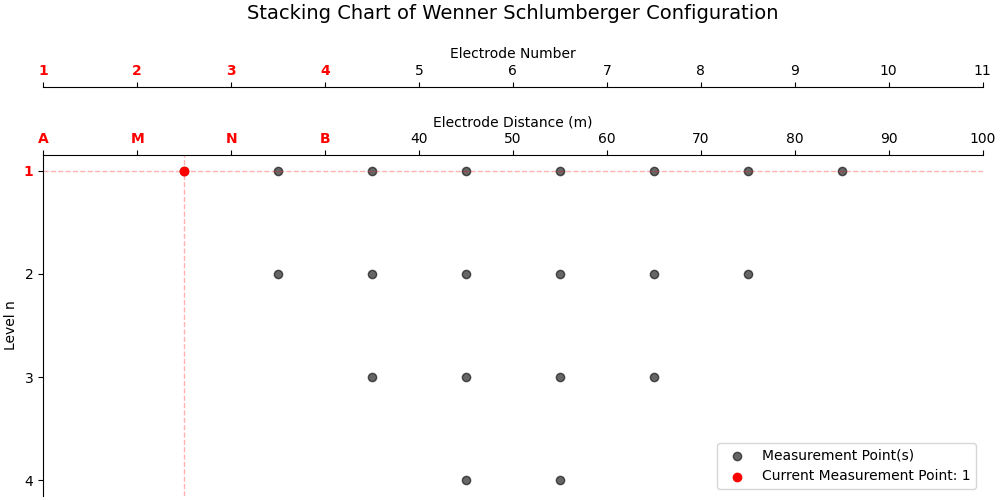
geolistrik generate \
  --configuration ws \
  --start-position 0 \
  --end-position 100 \
  --spacing 10
or
geolistrik generate -c ws -s 0 -e 100 -a 10The output files will be saved in the current directory with naming format:
ws_0_100_a10.pngws_0_100_a10.xlsx
This table represents the actual electrode configuration and data acquisition sequence used in the field:
Use the --no-plot option to skip chart generation:
geolistrik generate \
  --configuration ws \
  --start-position 0 \
  --end-position 100 \
  --spacing 10 \
  --no-plot
or
geolistrik generate -c ws -s 0 -e 100 -a 10 --no-plotThis will generate only the .xlsx measurement table.
Specify a custom output directory using --outdir:
geolistrik generate \
  --configuration ws \
  --start-position 0 \
  --end-position 100 \
  --spacing 10 \
  --outdir "./results"
or
geolistrik generate -c ws -s 0 -e 100 -a 10 --outdir "./results"All generated files will be saved inside the specified directory.
To update Geolistrik CLI to the latest version:
geolistrik updateTo install a specific version (upgrade or downgrade):
geolistrik update --version 1.0.1
⚠️ Geolistrik CLI v1.x is now End-of-Life No further updates or bug fixes will be provided.
You can uninstall version 1 and download version 2 on Installation Guide.
In version v1, parameters were provided as positional arguments:
geolistrik 0 100 10Starting from v2, Geolistrik CLI adopts an explicit command-based and option-based interface for better clarity, safety, and long-term maintainability.
-
Clone this repository:
git clone https://github.com/vysf/geolistrik-cli cd geolistrik-cli -
Install dependencies:
pip install -r requirements.txt
-
Run locally:
python -m geolistrik --help
-
Build with Nuitka: See
build.bator use:nuitka --standalone --onefile --include-package=geolistrik --output-dir=build geolistrik/__main__.py
-
Compile Windows Installer:
- Requires Inno Setup
- Run:
ISCC geolistrik_setup.iss
PRs are welcome!
- Fork this repository
- Commit changes to a branch
- Submit a pull request
- Or open an issue to report bugs/suggestions
📫 Contact: Yusuf Umar Al Hakim
✉️ yusufumaralhakim@fmipa.untan.ac.id
🌐 GitHub Project